
Welcome to the Part 3 of Business Analytics where we will dive deeper into variables and their application in data science. In this post, we will further see how they are applied in data science for business analytics purpose. In order to do so, we will look at some of the most basic but important in data science, hypothesis testing, p-value and t-tests.
Variables in Hypothesis & Analysis
Null Hypothesis
Null Hypothesis simply means that there is no relation between the two variable and data scientist use it to disapprove and reject a theory.
For example, if a eCommerce portal propose a theory that sales are up during a particular time in the year, null hypothesis will suggest that;
Particular time is not responsible for rise in sales.
Null Hypothesis is represented by H0.
Null Hypothesis implies that an event is not due to any impact of the variable but, due to PURE CHANCE.
Alternative Hypothesis
Alternative hypothesis is the exact opposite of the null hypothesis. So if we go back to our last example about sales in particular time of the year.
Alternative hypothesis will suggest that particular time is responsible for the increase in sales.
Statistical Significance
Statistical Significance is an important concept and in simple terms, it means that, likelihood of the event is attributed to specific cause and not, by chance or random.
Researchers need to calibrate their study for errors like sampling error.
Statistical significance in the context of null hypothesis means that lowest level of probability/likelihood at which null hypothesis can be rejected or disapproved.
As mentioned earlier in the this tutorial, sample size is a important factor in data science and lower level of relations between variables in a large sample size is more reliable than higher level of relations between variables in a smaller sample size.
p-value is used to measure the probability of rejecting the Null Hypothesis.
p-Value
p-Value in statistic is used to measure the significance of results.
p-value is the number which is measured to gauge the strength of the data. Conclusions are made based on the following outputs;
- P value less than 5 % (0.05%) indicates higher statistical significance and approve rejection of null hypothesis which simply means that variable are strongly related to each other and final output.
- P value more than 5%(0.05&) indicates lower statistical significance and support null hypothesis.
- P value close to 5 % is considered borderline.
There is one more statistical concept which I think will help you in preparing yourself for data scientist certification and that is,”t test”.
T Test
T test are of two types;
T Test for dependent samples
it is also known as “Matched-Pairs t Test”. It compares the mean of two samples which are related to each other. It is used when same sample could be used or tested under two conditions which are inter-related. For example, a group person undergoing SAS Business Analyst training at the same training center and then appearing for exam. You can test the knowledge score of same group at the beginning of the training and after training/exam to measure the difference in their skills due to the training course.
T Test for independent samples
It is one of the most widely used statistical calculation concept. It is primarily used to determine the difference between means for two groups.
Now if we use the example mentioned under “ T Test for Dependent Sample”, we can use the two randomly selected group from two different training institute preparing for SAS BA certification and evaluate the difference in the mean of their scores after SAS test.
Few important factors to mention here are;
- Size of the sample (bigger is better)
- Difference between means of groups should be big enough to indicate a substantial trend
- Average performance of the individuals is closer to the mean of their respective groups.
T Test Illustration
Let’s use the example mentioned above for T test for independent samples to calculate it.
- Create two groups of 20 students in each, studying in two institutes- Training Institute 1 and Training Institute 2.
- We will call these variables are N1 and N2.
- Now we record their scores in the certification exam;
| Training Institute 1-N1 | Training Institute 2-N2 |
| 75 | 95 |
| 85 | 19 |
| 47 | 27 |
| 79 | 63 |
| 99 | 97 |
| 77 | 60.2 |
Scores are presented in percentage (randomly chosen these numbers for illustration purpose)
- There are two different formulas for calculate t when two groups are of different and same size. As in our example, both groups are similar in size, we will be using following formula to calculate t;
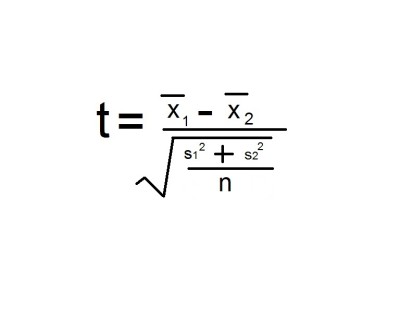
Sample mean 1 minus sample mean 2 divided by the square root of (sample variance 1 plus sample variance 2, over n)
- x1 is read as x1-bar and is the mean of the first sample;
- x2 is read as x2-bar and is the mean of the second sample;
- The variance is the standard deviation squared (hence s2) and I have used n-1 in calculations.
- The subscript numbers (1 and 2 to the bottom right of the x and s in the formula) refer to sample 1 and sample 2;
- I have used two tailed t-test and groups have equal variance for this calculation purpose
Upon execution of the formula mentioned above, t test score= 0.3898
You can use Microsoft excel to easily calculate t test but before that I will try to understand the concept before using the calculator.
You might have noticed that I have used two tail t tests in the above example. Two types of t test are used most commonly;
- One tailed test
- Two tailed test
You should use one tailed test when you expect only one group’s mean to change or when you expect changes to happen only in one direction whereas when you expect changes to move in any direction or any group can move in either direction (up or down), you should use two tail t test.
I have tried to not overkill these concepts but if you have any doubt, please leave your questions through comments.
In the next chapter we will further learn data science and statistics to understand more about it.
Good information.I would like your article.Keep share more articles and pass information. very informative related to machine learning. in business analyst this concept plays very important role. so its helps me to study all basic concept of business analyst.
have wonderful day!!