March 5, 2011 by akhilendra
Bollinger Bands & Rate of change Indicator

Bollinger Bands & Rate of change Indicator
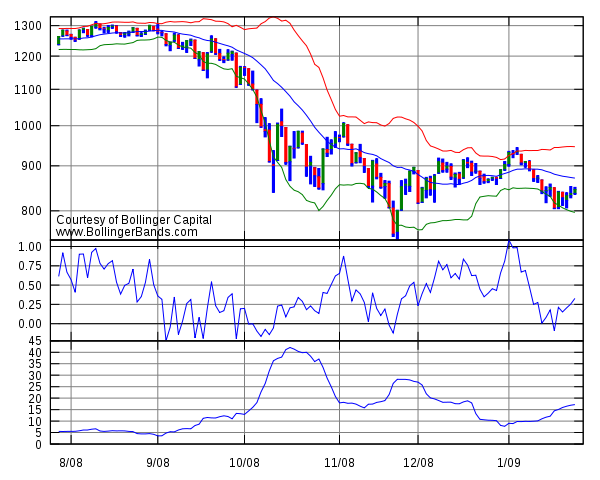
Bollinger Bands
Bollinger Bands are a technical analysis tool invented by John Bollinger in the 1980s. Bollinger Bands can be used to measure the highness or lowness of the price relative to previous trades.
Bollinger Bands consist of:
a middle band being an N-period simple moving average (MA)
an upper band at K times an N-period standard deviation above the middle band (MA + K?)
a lower band at K times an N-period standard deviation below the middle band (MA ? K?)
Typical values for N and K are 20 and 2, respectively. The default choice for the average is a simple moving average, but other types of averages can be employed as needed. Exponential moving averages are a common second choice. [note 1] Usually the same period is used for both the middle band and the calculation of standard deviation.
Interpratation
They can be used to determine if prices are relatively high or low. According to Bollinger, the bands should contain 88-89% of price action, which makes a move outside the bands significant. Technically, prices are relatively high when above the upper band and relatively low when below the lower band. High or Low doesn’t indicate Sell or Buy signals. Prices are high or low for a reason. As with other indicators, Chartists should combine Bollinger Bands with basic trend analysis and other indicators for confirmation.
Rate of change (ROC) Indicator
Rate of change is a momentum indicator which shows the percentage difference between the current price and the price n periods ago.
ROC = (Close – Close N periods ago) / Close N periods ago * 100
ROC moves above and below the zero line. when prices are moving up, it will move high and when prices are moving down, it will move down. It is a very useful indicator and is mainly used in measuring the trend. It is also sometimes referred as momentum indicator. As a momentum oscillator, ROC signals include centerline crossovers, divergences and overbought-oversold readings. It should be used in conjunction with other indicator before taking any final call.
ROC produces easily indentifiable oversold an overbought signals. When can buy the stock with positive ROC and Short stocks with negative ROC.
Leave a Reply