
January 13, 2015 by akhilendra
Business Analytics Part 8-More Data Science & Statistical Concepts

We have already covered many data science and statistical concepts in previous chapters. We will continue with basic and advance data science related statistical concepts with their business applications in this chapter as well.
Data Science & Statistical Concepts
Skewness
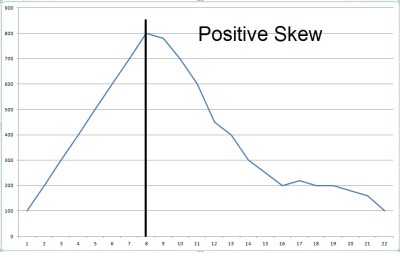
Skewness is the measure of the asymmetry or deviation from the symmetry in statistical analysis. it is basically used to represent the difference between mean and median. Skewness is usually divided into positive and negative skewness.
Positive Skewness– When there are more values at positive side(right side) in a curved graph, it is called as positive skewed or right skewed.
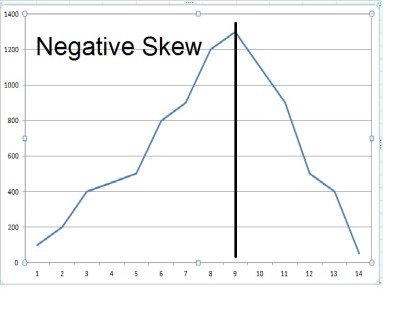
Negative Skewness– When there are more values at negative side(left side) in a curved graph, it is called as negative skewed or left skewed.
Kurtosis
kurtosis is used to represent the “Peakedness” of a distribution in probability. Kurtosis has following characteristic;
- High kurtosis – tall peak, rapid decline in the tails
- Low kurtosis – flat peaks, gradual decline in the tails
- Extreme case – uniform distribution
Poisson Distribution
Poisson distribution is used to asses the probability distribution of an event to occur randomly and independently of last occurrence or since it happened last time.
Poisson Distribution Dependencies/factors;
- number of event can be counted
- each occurrence is independent of each other
- average frequency of the occurrence is known
Confidence Interval
Confidence Interval is a interval value used to represent the interval for a population parameter where a sample will have high probably of having that parameter of interest based on sample data. Confidence Interval is a trpe of Interval Estimation Techniques.
Confidence Interval is used to represent the probability and is expressed in percentage.
Interval estimation is the technique of using data to estimate an interval of probable values of an unknown population parameter.
For example, There is a population or data where value of a parameter is not known. If you conduct repeated sampling and conduct experiments using same procedure, certain value of intervals will contain the unknown parameter. If you conducted 100 test and 95 of them were found to contain the unknown parameter, your confidence interval will be 95%.
Confidence interval = sample statistic + Margin of error
where
Margin of error = Critical value * Standard error of statistic
How To Construct Confidence Level
- Select a statistic that will be used to estimate a population parameter.
- Select a confidence level
- Find the margin of error
You can go through a very good practical example at wiki.
In the next chapter, we will see learn few more statistical concepts.
Leave a Reply