
December 28, 2014 by akhilendra
Business Analytics Part 4- Analysis of variance (ANOVA)

As mentioned in the first tutorial that these chapters are designed to help you learn and train for SAS Business Analyst certification and other data scientist certifications, we are going to first focus on topics which are more relevant for that and then we will explore the vast ocean of statistical concepts.
if you have gone through the last 3 chapters, then you have already got your foot wet with the basic concepts of data science and have a basic understanding about its operations.
In this chapter, we will primarily focus on ANOVA which is listed as one of the topics on SAS BA certification page and the technique is widely used in data science domain.
Analysis of variance (ANOVA)
Analysis of variance which is also known as ANOVA, is the statistical model or rather, collection of models which is used to measure the significant variation between groups of variable where usually means are used to measure the difference. It basically inform user about the difference in the mean of multiple groups for statistical significance.
You can use t-test if you are going to compare two groups, you can learn about t-test in our previous chapters.
ANOVA is primarily used when you are going to measure differences between more than 2 groups. ANOVA was developed by R.A Fisher.
In the last chapter while explaining t-test, I have used two groups preparing for SAS certification as an example to elaborate T-Test. Suppose you need to measure the performance for more than 2 groups, you will use ANOVA.
Type of ANOVA
- One Way ANOVA
- Two Ways ANOVA
Before we further move into ANOVA, let’s look at two important concepts which are integral to ANOVA.
F test
It is a test where distribution is F shaped. It is commonly used in ANOVA when means of the two population, having similar standard deviations, are equal.
Critical value is selected using the f table and then it is used to accept or reject the null hypothesis.
F values are non-negative, distribution is asymmetric and two independent degrees of freedom, one for numerator and one for denominator.
And the second concept is, test statistic.
Test Statistic
F test is used in test statistic where distribution pattern is f shaped. Test statistic is used to measure one attribute and is a standard value calculated from a sample data while performing a hypothesis test.
Let’s go through the following example to understand F Test;
| Sample 1 | value-mean | Squared | Sample 2 | value-mean | Squared | Sample 3 | value-mean | Squared | |
| 12 | -4.4 | 19.36 | 18 | -5.6 | 31.36 | 25 | -1.6 | 2.56 | |
| 14 | -2.8 | 7.84 | 19 | -4.6 | 21.16 | 26 | -0.60 | 0.36 | |
| 18 | 1.2 | 1.44 | 21 | -2.6 | 6.76 | 23 | -3.6 | 12.96 | |
| 22 | 5.2 | 27.04 | 29 | 5.4 | 29.16 | 28 | 1.4 | 1.96 | |
| 18 | 1.2 | 1.44 | 31 | 7.4 | 54.76 | 31 | 4.4 | 19.36 | |
| 16.8 | 57.12 | 23.6 | 143.2 | 26.6 | 37.2 |
Sum of Squares within Group = Sum of squares Sample 1 + Sum of squares Sample 2+ Sum of squares Sample 3
Sum of Squares within Group: 57.12+143.2+37.2= 237.52
| Now calculate total sum of squares using all groups | ||||||||
| Square | ||||||||
| 12 | – | 22.33 | = | -10.33 | 106.7089 | |||
| 14 | – | 22.33 | = | -8.33 | 69.3889 | |||
| 18 | – | 22.33 | = | -4.33 | 18.7489 | |||
| 22 | – | 22.33 | = | -0.329999999999998 | 0.1089 | |||
| 18 | – | 22.33 | = | -4.33 | 18.7489 | |||
| 18 | – | 22.33 | = | -4.33 | 18.7489 | |||
| 19 | – | 22.33 | = | -3.33 | 11.0889 | |||
| 21 | – | 22.33 | = | -1.33 | 1.7689 | |||
| 29 | – | 22.33 | = | 6.67 | 44.4889 | |||
| 31 | – | 22.33 | = | 8.67 | 75.1689 | |||
| 25 | – | 22.33 | = | 2.67 | 7.1289 | |||
| 26 | – | 22.33 | = | 3.67 | 13.4689 | |||
| 23 | – | 22.33 | = | 0.670000000000002 | 0.4489 | |||
| 28 | – | 22.33 | = | 5.67 | 32.1489 | |||
| 31 | – | 22.33 | = | 8.67 | 75.1689 | |||
| Mean | 22.33333333 | Total | 493.33 | |||||
493.33= Sum of Squares between Group + 237.52
To find out Sum of Squares between Group, mean of each group (sample, sample 1, sample 2 etc) – mean of all the groups (22.33 in this case)
| Sample 1 | 16.8-22.33 | = | -5.53 | 30.5809 | ||
| Sample 2 | 23.6-22.33 | = | 1.27 | 1.6129 | ||
| Sample 3 | 26.6-22.33 | = | 4.27 | 18.2329 | ||
| Total | 50.42 | |||||
| Total x 5(number of units in each sample) | ||||||
| 50.42*5 | = | 252.1 | corrected value | 255.81 | ||
You can also use basic algebra to figure out the value of sum of squares between groups, but I did it manually to give you some idea on how it is done manually. But round off is causing issues here, so we will use 255.81 to rule out errors.
Now Calculate Total/degree of freedom numerator where degree of freedom numerator=number of sample Groups – 1
255.81/2 = 127.905
Now Calculate Sum of Squares within Group/degree of freedom denominator where degree of freedom denominator=number of items within sample Groups – number of samples
237.52/15-3 = 19.79
F is ratio of total/sum of squares within group
127.905/19.79=6.46
Now We need to determine the critical value using the below table where numerator is at the top and denomincator are the horizontal lines, we need to determine the intersecting points of the table for 2 and 12.
| 1 | 2 | 3 | 4 | 5 | 6 | 7 | 8 | 9 | 10 | 11 | 12 | 13 | 14 | 15 | 16 | 17 | 18 | 19 | |
| 1 | 161 | 200 | 216 | 225 | 230 | 234 | ## | 239 | # | 242 | 244 | ## | ## | 249 | 250 | 251 | 252 | 253 | 254 |
| 2 | 18.5 | 19 | 19.2 | 19.3 | 19.3 | 19 | 19 | 19.4 | 19 | 19 | 19 | 19 | 19 | 19 | 19 | 19 | 19 | 19 | 19.5 |
| 3 | 10.1 | 9.55 | 9.28 | 9.12 | 9.01 | 8.9 | 9 | 8.85 | 9 | 8.8 | 8.7 | 9 | 9 | 8.6 | 8.6 | 8.6 | 8.6 | 8.6 | 8.53 |
| 4 | 7.71 | 6.94 | 6.59 | 6.39 | 6.26 | 6.2 | 6 | 6.04 | 6 | 6 | 5.9 | 6 | 6 | 5.8 | 5.8 | 5.7 | 5.7 | 5.7 | 5.63 |
| 5 | 6.61 | 5.79 | 5.41 | 5.19 | 5.05 | 5 | 5 | 4.82 | 5 | 4.7 | 4.7 | 5 | 5 | 4.5 | 4.5 | 4.5 | 4.4 | 4.4 | 4.36 |
| 6 | 6.99 | 5.14 | 4.76 | 4.53 | 4.39 | 4.3 | 4 | 4.15 | 4 | 4.1 | 4 | 4 | 4 | 3.8 | 3.8 | 3.8 | 3.7 | 3.7 | 3.67 |
| 7 | 5.59 | 4.74 | 4.35 | 4.12 | 3.97 | 3.9 | 4 | 3.73 | 4 | 3.6 | 3.6 | 4 | 3 | 3.4 | 3.4 | 3.3 | 3.3 | 3.3 | 3.23 |
| 8 | 5.32 | 4.46 | 4.07 | 3.84 | 3.69 | 3.6 | 4 | 3.44 | 3 | 3.4 | 3.3 | 3 | 3 | 3.1 | 3.1 | 3 | 3 | 3 | 2.93 |
| 9 | 5.12 | 4.26 | 3.86 | 3.63 | 3.48 | 3.4 | 3 | 3.23 | 3 | 3.1 | 3.1 | 3 | 3 | 2.9 | 2.9 | 2.8 | 2.8 | 2.8 | 2.71 |
| 10 | 4.96 | 4.1 | 3.71 | 3.48 | 3.33 | 3.2 | 3 | 3.07 | 3 | 3 | 2.9 | 3 | 3 | 2.7 | 2.7 | 2.7 | 2.6 | 2.6 | 2.54 |
| 11 | 4.84 | 3.98 | 3.59 | 3.36 | 3.2 | 3.1 | 3 | 2.95 | 3 | 2.9 | 2.8 | 3 | 3 | 2.6 | 2.6 | 2.5 | 2.5 | 2.5 | 2.4 |
| 12 | 4.75 | 3.9 | 3.49 | 3.26 | 3.11 | 3 | 3 | 2.85 | 3 | 2.8 | 2.7 | 3 | 3 | 2.5 | 2.5 | 2.4 | 2.4 | 2.3 | 2.3 |
| 13 | 4.67 | 3.81 | 3.41 | 3.18 | 3.03 | 2.9 | 3 | 2.77 | 3 | 2.7 | 2.6 | 3 | 2 | 2.4 | 2.4 | 2.3 | 2.3 | 2.3 | 2.21 |
| 14 | 4.6 | 3.74 | 3.34 | 3.11 | 2.96 | 2.9 | 3 | 2.7 | 3 | 2.6 | 2.5 | 2 | 2 | 2.4 | 2.3 | 2.3 | 2.2 | 2.2 | 2.13 |
| 15 | 4.54 | 3.68 | 3.29 | 3.06 | 2.9 | 2.8 | 3 | 2.64 | 3 | 2.5 | 2.5 | 2 | 2 | 2.3 | 2.3 | 2.2 | 2.2 | 2.1 | 2.07 |
| Now we have; |
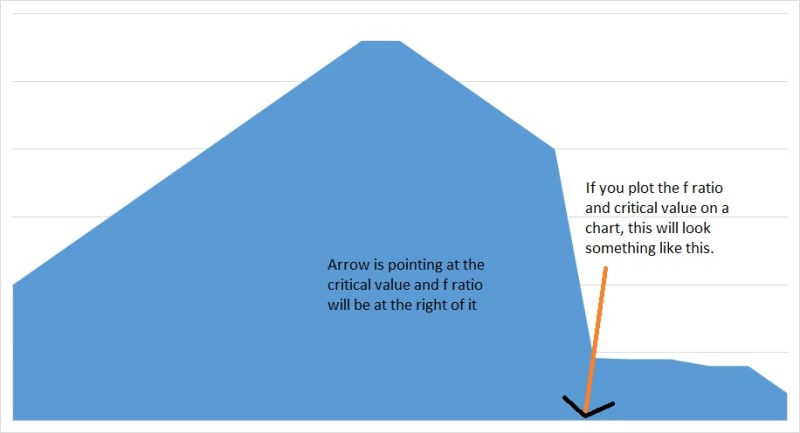
| F(2,12)= 6.46 |
| critical value=3.89 |
As f value or ratio is greater than critical value and above 5%, null hypothesis will be rejected.
So coming back to ANOVA, it is one of the most widely used techniques in psychological experiments to collect and examine data.
Please find same calculation in the excel format, please note that some of the cells don’t have formulas so you can manually calculate them but most of the functions are already there;
Download F test calculations
Assumption of ANOVA
Assumptions of ANOVA are very important in data science field. They are also required for SAS BA exams. So now we will look at assumptions of ANOVA.
- Dependent variable are normally distributed and have same variance.
- Errors are normally distributed and are independent.
We will further look into the assumptions and one way ANOVA in the next chapter.
https://www.facebook.com/people/Pinkich-Chaurasia/100008427549774">Pinkich Chaurasia - December 29, 2014 @ 7:28 am
Hi,
This is a wonderfully comprehensive post on SAS Business analytics part 4- analysis of variance. I enjoyed this article. I would love to see some more such interesting article from your side.
Thanks for writing and I hope that you’ll have a happy weekend.
Keep up your great work!