
September 20, 2015 by akhilendra
What is GGPlot2 & How To Use It

Ggplot2 is an advance R library designed for creating charts. Ggplot2 is one of the 3 graphics system in R, other than base and lattice. it was written by Hadley Wickham.
Web site: http://ggplot2.org
GGplot2 Overview
Are you interested in learning R for data analysis and machine learning, click here.
GGplot2 is like a R grammar system for graphics where the syntax consists various parts of graphics and you can build graphs using this syntax provided by ggplot2. Its like mapping various attributes of graphs in R, it addresses various components of graphs and stitch them together to a build complete chart. These are important elements of Graphs in ggplot2 in R;
· Data· Aesthetics like shape, size, and color· Geometic objects like points, lines etc
Broadly it is similar to other graphics systems in R, it will look for the data in data frame or environment and graphs are made up of aesthetics (shape,size, color) and geoms (points, lines). GGPlot2 consist for 2 graph functions and they are;
- ggplot
- qplot
ggplot vs qplot
As mentioned above, these are two ggplot2 functions which are used to create graphs in R using ggplot2 graph system. The utilization of either of them depends upon the complexity & requirement of the project.
· ggplot is used for larger complex data
· qplot which is used for simpler data sets
ggplot() is the core function and it is used when qplot is not sufficient whereas qplot is used when you are not looking at too much of functionality.
Like other R libraries, you first need to install ggplot2 library
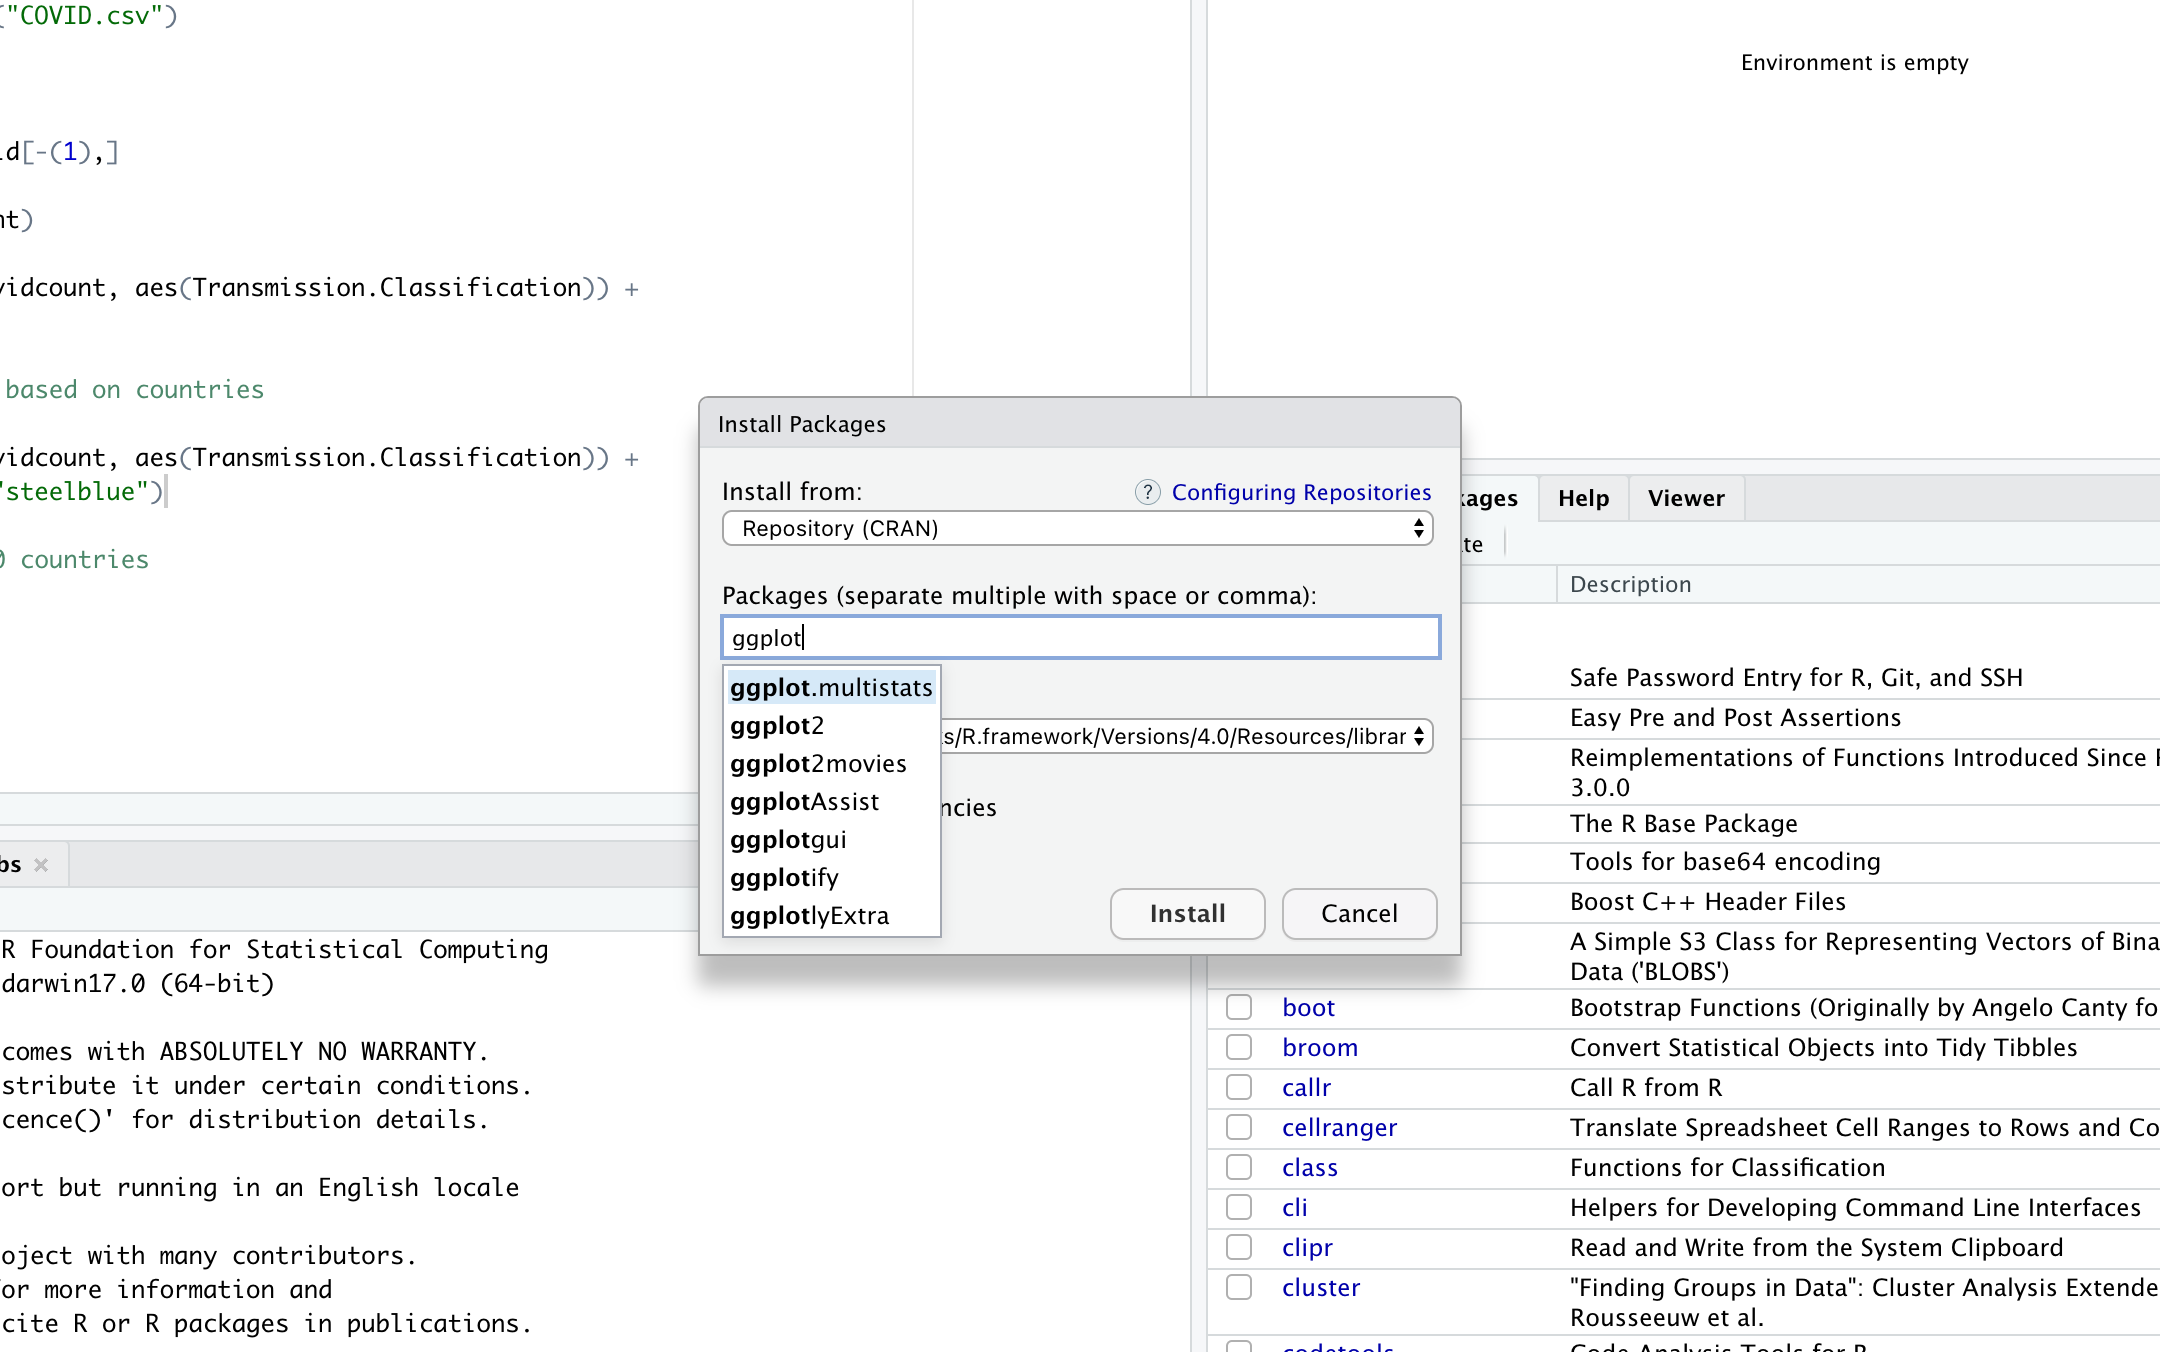
Installation of GGPlot2 in Rstudio
You can install it through following ways;
- Go to packages in the right hand menu of Rstudio and search for ggplot2.
- or you can search for tidyverse and install that. GGplot2 is part of tidyverse. Tidyverse will install few other libraries also.
- Alternatively, you can also use install.package command to install ggplot2.
- You can visit ggplot2 page at https://ggplot2.tidyverse.org
install.packages("ggplot2")
or
install.packages("tidyverse")
After installing, Initiate ggplot2 in R studioCode by this code: let’s use the in-built dataset for qplot example;
library(ggplot2)
You don’t need to specifically load datasets like mpg which we will use in this ggplot2 tutorail but if you are using any custom dataset, don’t forget to load that in the session.
If you are in rstudio, you can run following commands to check if mpg dataset is accessible.
str(mpg)
Now we can use qplot which is part of ggplot2 family to create basic plots. It’s a simple function which can be used instead of ggplot2 if you are looking for basic plots without much customization. GGplot2 is recommended if you are looking for highly flexible and customizable visualizations.
Now we can use qplot for this basic chart where
- displ is the x coordinate
- hwy is the y coordinate
- mpg is the data frame
library(ggplot2)

str(mpg)

qplot(x=displ, y=hwy, data=mpg, geom="auto")
you can replace these variables in your graph to get desired result. Above code will generate following graph;

ggplot function
ggplot accepts and need following elements in the command;
• A data frame
• aestheic: details of data mapped to aesthetics like color, size
• geoms: points, lines, shapes.
• facets: in case of conditional plots.
• stats: quantiles, smoothing.
• scales: male = red, female = blue etc
• coordinate system
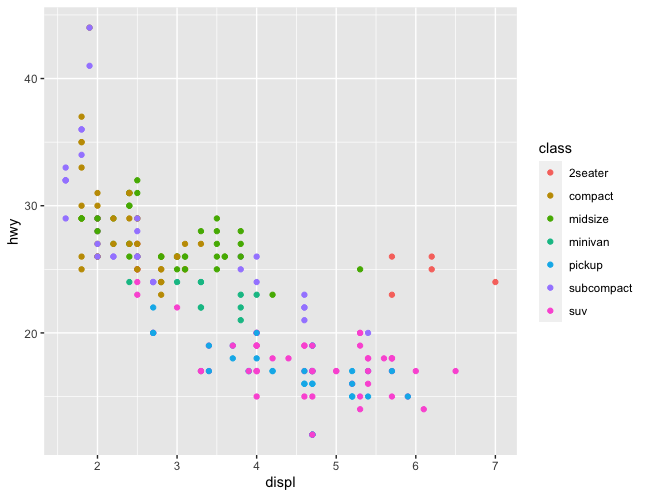
Let’s use the above mentioned data set for ggplot example, in this case we will first create objects for each activity and then use them to print graph;
ggplot(mpg, aes(displ, hwy, colour = class)) +
  geom_point()
It will generate following graph;
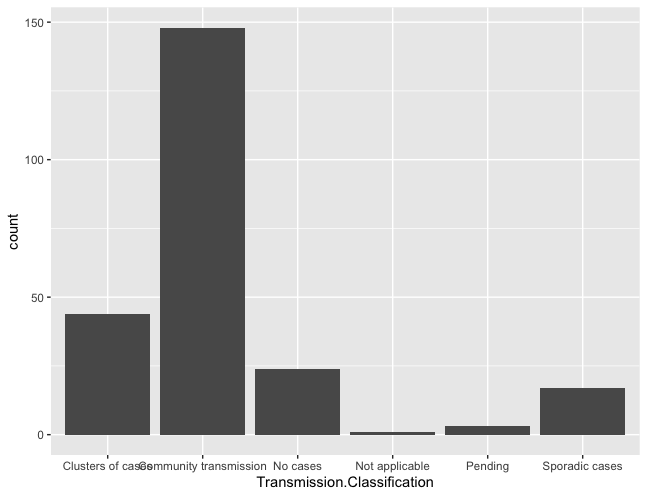
Now let’s plot a bar graph with ggplot on a different dataset. Now we are going to use a different dataset. We are going to use COVID-19 dataset.
Let’s load the data, do some cleaning (remove first row) and plot a bar graph using ggplot2.
covid = read.csv("COVID.csv")

#global data row

covidcount = covid[-(1),]

summary(covidcount)

ggplot(data = covidcount, aes(Transmission.Classification)) +
  geom_bar()
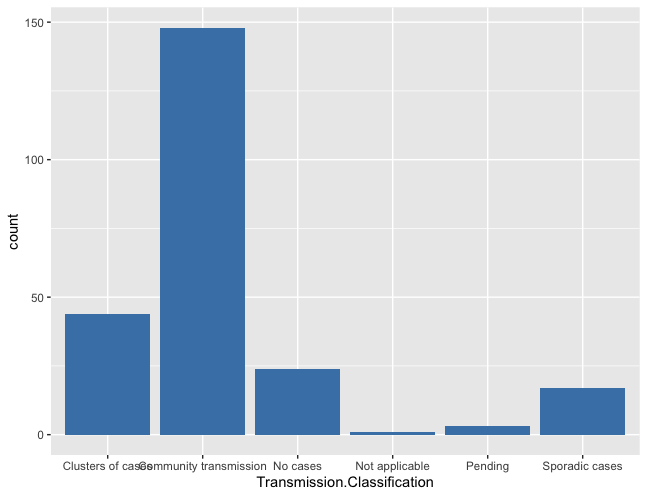
Now let’s add some color to it. We can use fill to pass colors to it.
ggplot(data = covidcount, aes(Transmission.Classification)) +
  geom_bar(fill="steelblue")
Please leave your comments if you have any questions.
Please click on the link to see few more implementations of ggplot2 in R- Data exploration with GGplot2 & R
Leave a Reply