December 4, 2018 by akhilendra
How To Use Azure ML Studio to perform Multiclass Logistic Regression

Do you want to learn Regression?
Become a data scientist
Learn linear and logistic regression with R & Python.
Download android app for better experience.
Azure ML studio has become of the most popular machine learning tool among machine learning community and it is currently widely used across industries & geographies. Thanks to azure’s hold in enterprise software development, it wasn’t a big surprise.
Azure ML studio makes it easier to run all kind of machine learning models using built-in and ready to use features instead of coding entire program.
You can do everything in Azure ML studio with 0 to minimal coding. But having said that, you need to understand machine learning fundamentals and concepts to make maximum out of it.
Because you need to understand how data effects the quality and output of the model. You need to know how to handle if there is missing data in your dataset.
Azure ML studio makes it easier to handle the missing data with “clean missing data” functionality and they provide arrays of features to handle it, but you need to understand the impact of the selected feature. For example, if you are using “Replace with mean”, you need to understand its impact on your overall analysis.
Similarly, you need to understand the impact of the options in given screenshot to use the most appropriate option for your analysis. If there aren’t many observations with missing data, it is recommended to drop these values from analysis. But be careful with whatever option you select.
If you are looking to learn activation function or evaluation metrics, click on the link below;
How to use “Clean Missing data” in Azure ML studio

Step 1– search missing or clean in the search bar in the left-hand side
Step 2- drag and drop “Clean Missing data” on the canvas” & Link it to your dataset.
Step 4- select the “clean missing data” on the canvas, it will display the clean missing data module on the right-hand side of the screen.
Step 5– use “launch column selector” to select the desired column/s.
Step 6- select appropriate/desired values in the cleaning mode.
Please note to try out experiment with different values in cleaning mode and see which one delivers better results.
Similarly, it provides arrays of machine learning model to be used without any coding. But you need to understand the concepts behind these ML & predictive models before you can use them properly.
I have performed a multi-class logistic regression model using Azure ML studio. If you want to know how to use Azure ML studio to perform machine learning models without coding, please continue with this post.
Please note I haven’t covered machine learning concepts in this post, so you will need to learn them to use this great tool effectively but still, you can use this to learn to know about Azure ML studio.
How to perform Multi-class logistic regression with Azure ML studio
In this demonstration, we are going to perform Multi-class logistic regression model on google analytics data of a website’s visitors.
In this Multi-class logistic regression model, we explore data of google analytics’ website traffic for a website.
Data contains;
1. Number of sessions.
2. Average session duration
3. Bounce rate
4.Revenue
5. Transactions
6. Goal conversion rate
Data has been updated to remove any sensitive information and this analysis is only for demonstration purpose.
Usually you will create a project and then use that for all the experiments and everything but here I am directly using experiments in azure ML studio.
Step 1– click on the new button

Step 2– this is a common button to create project, experiments, upload dataset from local machine, add modules or add notebook. Notebook option gives ability to add python or r script along with few other options. You can use module option to import libraries or model to create chart etc.
Step 3– we will first upload our data set. So, click on the “DATASET” option.
Step 4– Click on “from local file” & upload the file from your computer using this wizard.


Step 6– you can use add to project button to directly add this file to a project. But this is optional at this stage.

Step 7– now come back to experiment menu and select it. You can use “Blank experiment” if you are using your own data set or you can use any existing samples if you want to explore it using existing data sets & models. For this demonstration, we are going to use blank experiment. Click on blank experiment.

Step 8– This is the first screen, you will see when a blank experiment is launched in azure ML studio. It will have 3 columns.
First column at left hand side have all the datasets, ML models and variety of options to choose from. This column is dedicated to models which you can use in Azure ML studio.
Second column in the middle is your canvas where you will drag and drop options from column. This is your playground where you will build everything. 3rd column is used for displaying properties for the selected item in canvas. So usually you will first select something in column 1, drag it on your canvas (column 2) and then select it in canvas.
When you select it in canvas, it will open the 3rd column where you can view or modify its properties. Menu options at the bottom of the page are quite simple, you can use them to save your experiment, publish it to azure ml studio gallery or setup as a webservice. In this post, we are not going to talk about webservice part.

Step 9– we need to import our data set in the experiment. Please note that in the step 4 when you uploaded your data in the azure ml studio. It was uploaded in the azure ML studio, it isn’t part of your experiment yet. Therefore, we need to select the dataset for our experiment. We will use “Saved dataset” option in the column 1 to do that. When you click on this, it will expand into two categories;
- My datasets
- Samples
My datasets will contain all the datasets uploaded by you.
Samples will include all the datasets offered by Azure.
For this demonstration,we are going to click on “My Datasets” to expand it. We will select desired dataset from this option and drag it on canvas.

Step 10-Now we will use search bar in the first column to search & select “Edit Metadata”. Whenever we need a function or model, we will use this search bar to find that. In this step, we will select “Edit Metadata” & drag it on canvas. Now we will link our dataset to the “Edit metadata”. Please note we use these circles on each box for linking purpose.

Step 11– red icon highlighted in the last image indicates that this box need some input. This red icon will be present in all boxes wherever any user input is required. In case of edit metadata, we need to select columns & edit the data type if needed. For this analysis, we don’t need to make any change in the data type, so I will simply demonstrate the selection and move on but in many cases, you may have to change the data type. In those cases, you will need to use edit metadata. So, select this box which will enable the properties column in the right.
Click on the “launch column selector”.

It will launch a pop window where left half will display the list of all the columns in your data set. Use > button to select the desired columns. In this step, we will select all columns, click on to close the icon with selected columns. As we are not changing the data type, let’s move on to next step.

Step 12– now we can go through “select columns in dataset”. This button is used when you need to drop any column/variable from analysis.
Usually unique IDs are not required for machine learning algorithms; therefore, we can drop sessions which is a unique id in this case.
So, we will first enter “select” in search bar and hit enter. It will return all options, we will click on “select columns in dataset”, select and drag it on canvas. Link it to “Edit metadata” and select this box. This will enable the properties column in the right-hand side.
Click on “Launch column selector” by clicking on it.
It will open a pop-up window where you can select the desired columns. There are two options here to “begin with”;
- All columns
- No columns
By default, this pop up is opened with “no column” selected which essentially means that you need to select all the desired columns whereas if you select “all columns”, you will have options to either include or exclude the desired columns. In our case, we need to select all columns except “Sessions”, so I will use exclude and specify “Sessions” column. This will include all the columns in our analysis except “Session”.


Step 13– Now click on Run.
Step 14- whether you are using Azure ML studio, R, Python some other tool to run a machine learning model, you need to split your data into training and testing datasets. Fundamentally, you are creating 2 groups out of your sample/dataset. One group will be used for training and 2nd group will be used for testing.
Usually training group is larger in comparison of testing set to assist better learning. Ratio between training and testing could be anything between 70% training & 30% testing to 50/50,50/20 or 75/25. These numbers are discretionary, and you can try out whatever you prefer.
Let’s search for the split function/module, drag and drop it on canvas using same methodology which we have seen so far in this post.

Now we need to select appropriate option in the splitting mode and enter required details. For this post, I am going ahead with the simplest method- “Split Rows” and go with default values. In real world challenges, you can try out different values in this option and run your experiment to determine the optimum values for your dataset.

Step 15- click on Run.
Step 16– Now we need to do 2 things;
- Select the appropriate model to run on our training dataset
- Train model
So first we are going to search for appropriate machine learning model. Azure ML studio comes loaded with many such models, in this case, we are going to use Multi-class logistic regression.
Now we will search multi in the search bar, click and drag it on canvas.
Now we need to repeat the above step for “Train Model”. We will search, click & drag it on canvas.


Step 16a – now we need to link train model to “Split data” and “Multiclass logistic regression. Please refer to screenshot to link them correctly. When you select 1 point on the train model, Azure ML studio will highlight corresponding point in the green and other one in red indicating correct point for linking it. These points represents inputs and outputs.

Step 16b– select “Train model” to enable the properties column in the right-hand side. In the properties, we will again use “Launch column selector” to select the desired column for output/dependent variable.
In this step, we will select “Goal conversion rate” as desired column. Please note that you will be able to select only one column here.

Step 17– now search “Score model” in the search bar. Click and drag it on canvas. Link it to “Train Model” and “Split data” as shown in the screenshot.

Step 18– Click on Run.
Step 19-after deployment is complete, you can select the “Score model” and right click to visualize the output.
Please note, you will need to select a column to see its graph in the visualization. By default, visualization will be blank.


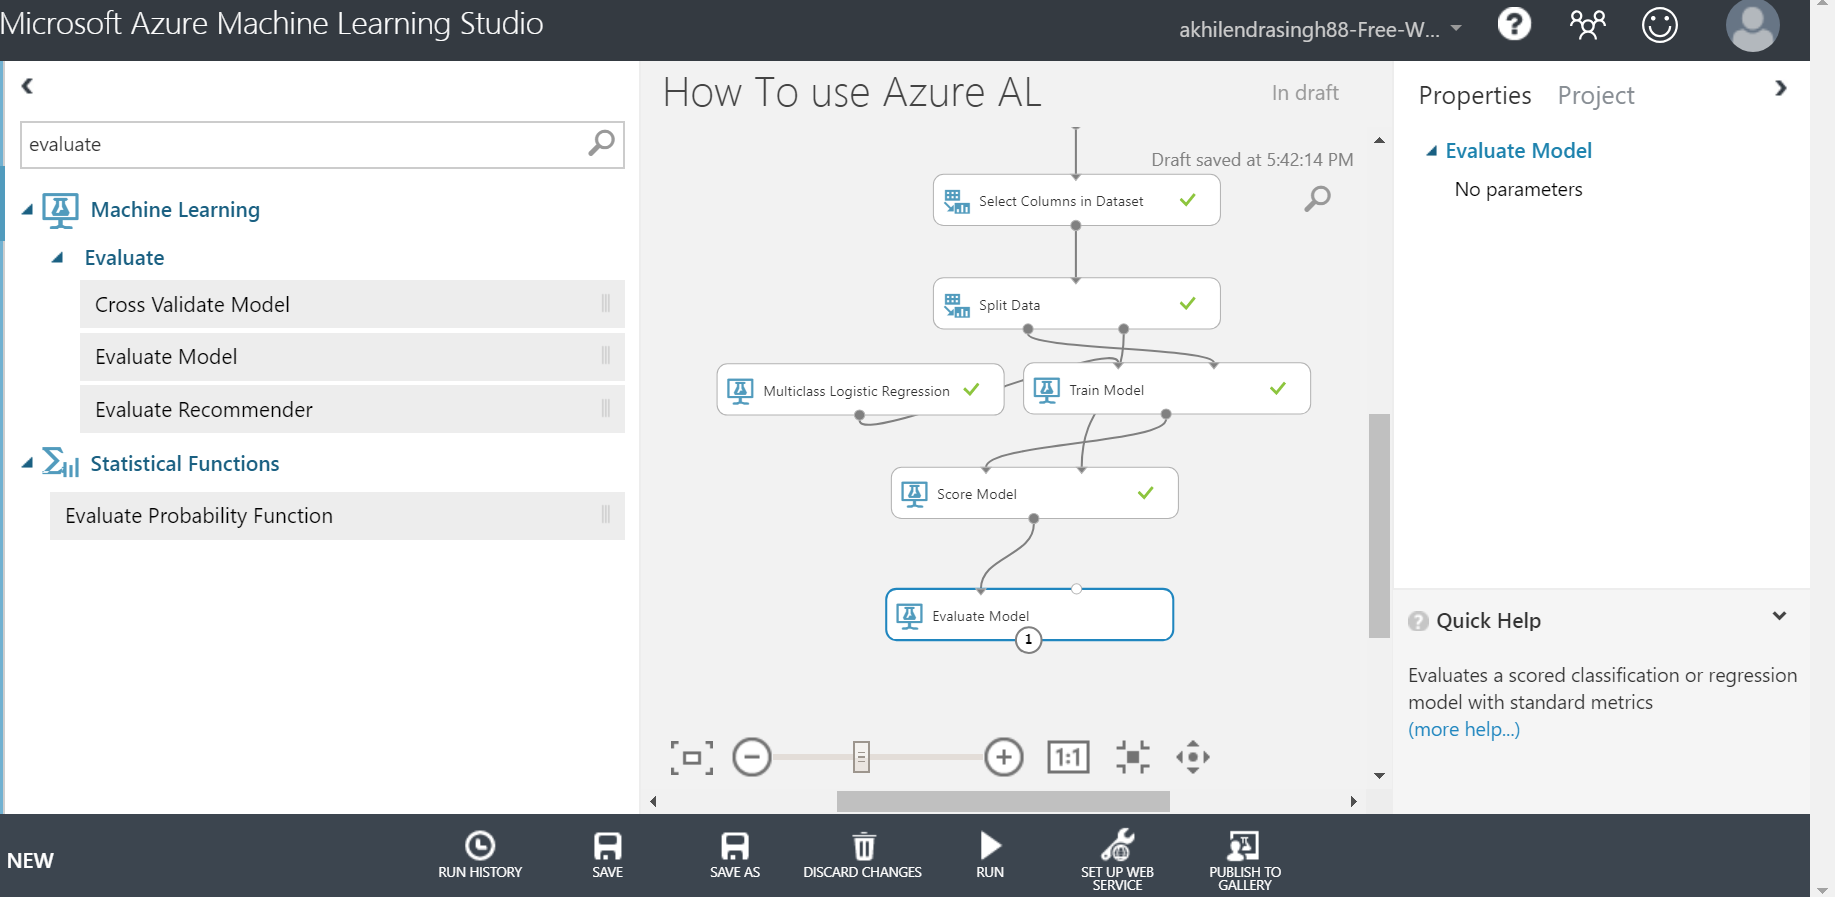
Step 20- Final step is to evaluate our model. Therefore, we need to search, click & drag “Evaluate Model” on the canvas. Link it to score model as shown in the screenshot.

Step 21– Click on Run.
Step 22– We can visualize its output using same method, right click and select “Evaluation result” followed by “Visualize”.


Please note that if you select different model and not multiclass logistic regression, you may receive different output here.
Step 23- now your model is complete. You can save it, setup as webservice or publish it to Azure ML studio’s gallery.
You can also find model in azure ML studio’s gallery at;
https://gallery.azure.ai/Experiment/Multi-class-logistic-regression-on-Google-analytics-data
But as mentioned in the beginning of the post, idea here is to demonstrate on how to use Azure ML studio and not cover fundamentals of machine learning.
Please note that you can run multiclass logistic regression using R or Python also but it won’t be that easy.
If you have any question or doubt, please leave your comment. And don’t forget to share it with your friends and colleagues.
Leave a Reply